Project Portfolio Dashboard Template Excel for Reporting
Before you can propose a strategy for your project, you must have the proper tools to collect the data you need. A Project Portfolio Dashboard Template is a very helpful tool in meeting the requirements of your ongoing business.
The dashboard contains a few spreadsheets. One of the most important and useful features of the dashboard is, it shows data in graphical and chart form.
This allows you to handle and control multiple projects at a time. So, it basically adds up all the key indicators of all the individual projects in one singular place.
The dashboard structure can differ according to its needs. This tool will also allow you to monitor data in diagram form and will eventually help you in better communication with your business team. This will ensure and help to create trust in your team.
Project Dashboards benefit by picturing critical achievement elements and work breakdowns to minimize your efforts efficiently. Project Dashboard Template can also be used to report the status of a certain level of management. This shows a quick overview and is helpful for business chiefs and owners to have a quick glance at the progress.
In this article, we will see what the project portfolio dashboard template is and how is it important in project management. We will also see what different kinds of projects dashboard are available.
Why Should I Use Project Portfolio Dashboard Template
As we have discussed above a dashboard can help you tremendously in managing your project. It also allows you to collect, add up, and coordinate vital design data in one place.
It is an efficient way of transmitting data about a project without complicating the details to the related stakeholders.
What’s Included In a Project Dashboard
The project portfolio dashboard template is a combination of the explanation of data in table or diagram form. It also offers significant information involving projects and how they should be handled by summarizing procedures and techniques that require to be pursued.
- The Excel project dashboard gives a quick review of critical parameters and their statuses using graphs. This can help in saving time and facilitating having a bird’s view of all the development in the project.
- The project dashboard comes with the option of a status indicator which will help you to be able to set the overall project position and plan on the dashboard.
- Also displayed are task details which will help in making quick decisions about the project. This data will assist the management in identifying how many responsibilities and tasks are pending.
- The dashboard also follows the budget on a monthly basis which makes it simple and easy to access if the financial plan is yet on track or not.
Project Portfolio Dashboard Template Excel is an invaluable tool for effective project reporting and management. This user-friendly and dynamic template allows project managers and stakeholders to gain comprehensive insights into multiple projects’ status and performance on a single platform.
The dashboard provides a bird’s-eye view of various key performance indicators (KPIs), including project timelines, budgets, resource allocation, and task progress.
Elements of Project Portfolio Dashboard Template
The most important and essential thing to run a project properly is to see whether or not the project is running smoothly and on track.
It also serves as an indicator showing if there is any problem along the way or not. If you can catch the issue beforehand you can easily manage to resolve it before making any damage.
It should also provide development assistance, which is a standard guideline for how we must establish each project’s managing tools.
Project Portfolio (Dashboard Section)


Project Portfolio (Project Section)


Project Portfolio (Task Section)


Project Portfolio (To-Do List Section)


Portfolio Dashboard Will Help You to See the Following Things
- The overall picture of all projects on track
- Scope of project requirements or opportunities
- Project Progress showing if you are ahead or behind
- Project income, cost, and revenue
- Consumption of resources
- Project risk analysis
Project Portfolio Management Templates
The making project portfolio dashboard template Excel is an excellent choice for project management. Because this can help in managing data effectively and can be merged in Excel clearly.
It is a user-friendly and straightforward tool. In case you want to add more information or alter the format you can do it easily in Excel. Therefore, eventually, it results in saving time and effort.
The templates which are included in the Project Portfolio Dashboard category are as follows:
- Gantt Chart Templates for Project Planning
- Tracking Templates
- KPI Dashboard Template
- Project Portfolio Dashboards
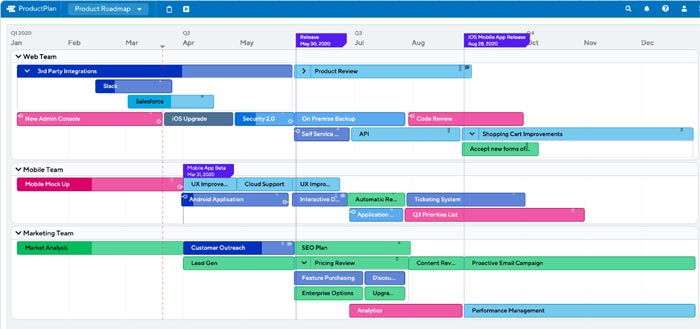
- Interactive Project Timeline Chart
- Project Management Charts
- Project Dashboards
Project Portfolio Dashboard Template in Excel is a versatile tool for project management and reporting. It provides a visual representation of key metrics such as project timelines, budgets, resource allocation, and project status.
KPI Dashboard Template
This Dashboard will trace key data points by using a KPI dashboard to boost business accomplishment. This tool will help you save time. You do not need to serve hours on multiple reports.
The KPI dashboard template permits you to see numerous KPIs in both tabular and graphical formats. This will also compare the performance of different tasks in one go. This is easy to use and user-friendly tool.
Product Metrics Dashboard Template
Key metrics provide product information not only to product managers but also to stakeholders and others within an organization. This data could include metrics related to monetary performance, customer interaction with a product, or other business goals.
Once you have identified the key metrics and KPIs for your products, you can track them using a product metrics dashboard. This free template offers a simple interface for tracking and visualizing information.
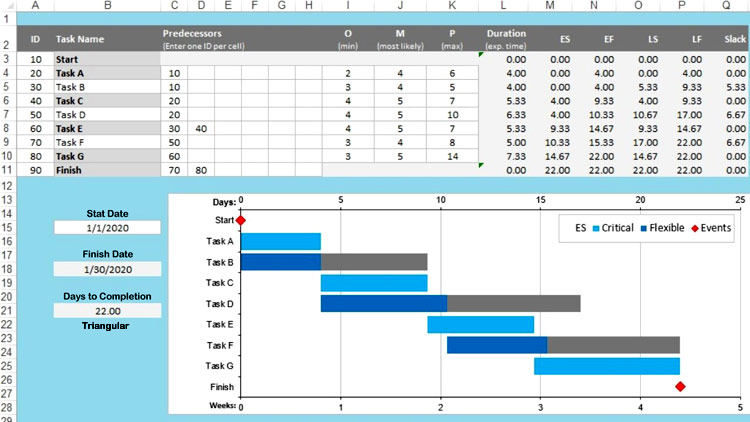
Gantt Chart Excel Template
Project managers always look for a tool that will help them organize their data effectively. They often use Excel for project management in organizing and coordinating their project information for appropriate analysis.
However, basically, Excel itself is not a project management tool on its own but it can be merged and linked with other tools like the Gantt chart template. This will aid to enhance the presentation and productivity of the project management group.
It can show the mutual connection between the activities of a project and can be applied to see the importance of a project.
Project Charter Template
A project charter template is essential and another one of the most helpful tools in the project portfolio dashboard template. This tool will direct you to the successful completion of your project.
This will allow you to monitor the scope and goals of the project along the way. By using this tool, you surely will achieve the main objective of your team.
Furthermore, this will ensure that your project is on track as planned. You can also manage and keep a bird’s eye on the deadlines of different tasks in your project.
Another important feature of a project charter is that it helps in quickly and briefly reviewing your major portfolio data. As a result, you can keep continual track of the progress of work.
One of the significant advantages of this template is its ability to consolidate data from different projects into easy-to-read charts and graphs.
This not only streamlines the reporting process but also facilitates data-driven decision-making. With real-time updates, stakeholders can quickly identify potential bottlenecks, risks, and opportunities, allowing them to take prompt actions to keep projects on track and within budget.



Thank you!!1
Hi LANDINGHAM2508
Thanks for your visit. Hope you find this template helpful.
Regards
John
Can you please send me a copy of the template -> germanturno@gmail.com
Hi LANDINGHAM2508
Can I please have a copy of this PPM dashboard? looks very useful, thanks!
Hi Bro,
Look this is a great template. Could you please share this to email:dmcangbf@gmail.com?
Very thanks you.
Hello,
I would like to receive this Project Portfolio Management Template.
Thanks
Anthony Salapete please check your inbox.
Hello,
Can i also get the Project Portfolio Dashboard Template Excel.
Thank you
Hello,
I would like to receive this Project Portfolio Management Template.
Thanks
Hi There, I would like to receive this template please?
Hi Leyya Kalla
Thanks for your visit. Please check your inbox.
Regards
hi,
I would like to receive the template.
thank you
Ammar
hi PMT
I would like to receive the template please
regards
Gwyllym
Good Day,
May I receive the template please.
Thanks and Regards
Chris – France
This is a great template. Could you please share the template? Thank you.
Hello,
Could you please share the template with me.
Thank you
https://template124.com/project-plan-portfolio/
Hi,
Thanks for the good job. Could you please share the template?
Regards
Hi,
Can you please share the Dashboard template file. Thanks in advance.
regards.
Is it possible to send me a copy of this template?
Is it possible to send me a copy of this template?
Hi Akua
Please use the link below to get access!
https://template124.com/project-plan-portfolio/
Hi, very useful info, thanks.
Could u please send me the templates,
Regards.
Hi Author,
Kindly help me with a copy of this dashboard it really look useful.
Regards
Hitesh
Hello,
Can I get a copy of this interesting tool ?
Thank you in advance.
Best Regards,
Hi, excellent tool…is posible to get a copy of your template?
Thanks.
Hello,
I would like to receive this Project Portfolio Management Template.
Thanks
Hi
Your tool looks great. Can you please send me a copy?
Thanks in advance and have a good weekend!
Hi
Your tool looks great. Can you please send me a copy?
Thanks in advance
Pls. send a copy of the dashboard template
Hello,
May I request you to send me a copy of the project portfolio dashboard please ?
Looks great!
Thank you
Could you please share the template.
Thanks!
Hi
Can I get the Project Portfolio Dashboard Template Excel.
Thank you
Please provide me template
Looking for good PM portfolio and program management templates.
Would appreciate any shared resources
Can you please share this template with me. This will be useful for my PMO reporting needs,
Thanks !
I would really like a copy of this dashboard/ templates. Where can I find them or get a copy of them to use
Hi there,
Looks like a great template!
Would you send me a copy please?
Thanks.